ValeriusBeta - Not investment advice

About Valerius

Research you can check.

Valerius is AI research for people who do their own investing. It gives you the numbers, the filing and your own record, and names its sources. It won't tell you what to buy.

Why it exists

Fast answers are easy to find. Answers you can trace are not.

Individual investors have more data than ever and less time to check it. Many AI tools answer in seconds without showing where the answer came from. Valerius is built the other way round: each scorecard check shows the figures or reasoning behind its score, and Deep Dive links each claim to the passage in the filing it came from.

Example: the 13-point value scorecard

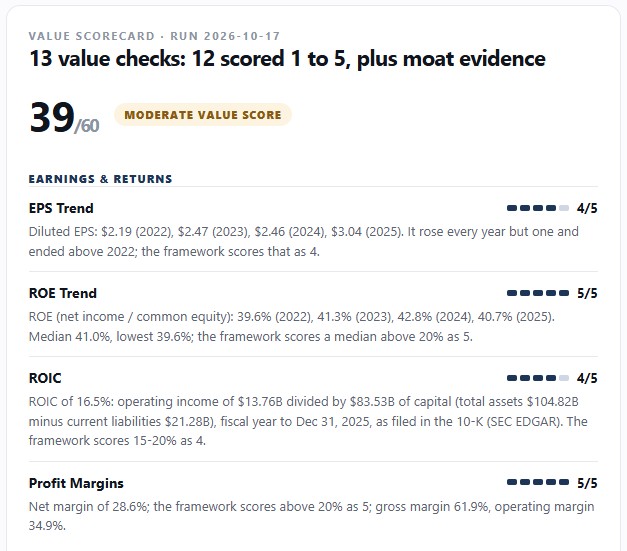
Free on the S&P 500 research pages. Twelve checks, from EPS trend to margin of safety, are scored 1 to 5 by fixed rules where the data allows, with the figures behind each, so you can see why it landed where it did; the moat is shown as evidence from the company's filings.

Value Scorecard for Coca-Cola (KO), 39 of 60, moderate value score: the first four checks, each scored by a fixed rule with the figures behind it

Coca-Cola (KO), from its free research page, Oct 17, 2026. Scores change as the figures do.

What it does

Three ways to use Valerius.

Start with research. Keep what matters. Add your reasoning only if you want to.

Research

Ask, read, compare

Value scorecard

13 checks on S&P 500 stocks and other profitable NYSE and Nasdaq stocks of $1 billion or more: 12 scored 1 to 5 where the data allows, and the moat shown as evidence from the company's filings, with the figures behind each. Banks and REITs get their own version, because a few of the standard checks don't fit how they work.

Ask Val

Questions about any stock, answered from current market data with the source named.

SEC filings

AI summaries of a company's 10-K, 10-Q and 8-K filings, pulled from SEC EDGAR.

Keep

Watch what matters

Alerts

Set a price or earnings-date alert on any stock you follow. Valerius checks every weekday.

Saved screens Max

Describe what you look for and see which S&P 500 companies meet your rules. Max checks them every weekday after the close and emails you when a company starts or stops meeting them.

Portfolio import

Paste your broker's positions table or upload a .csv. You check every row before anything is saved.

Score vs. consensus

Shows the stocks on your list where the model score and analyst consensus differ.

Your reasoning, if you want it

Write down why you own it

Thesis library

Your target, your exit, your logic, kept in one place.

Deep Dive Credits

Checks your thesis against the company's latest 10-Q, where it files one, and links every claim to the passage it came from.

Macro impact Credits

Relates your thesis to the five latest FRED readings, from the Fed Funds Rate to the 10-year Treasury yield.

Investor DNA

After five closed theses, reports the patterns in your own reasoning. Not a judgment, and not advice.

Banks and REITs

Scored by the measures their own industries use.

A bank borrows in order to lend, and a REIT must pay out most of its income, so a few standard checks don't fit them. For these companies, Valerius uses the measures their industries report instead. Every other check is the same, and every score is still a fixed rule on reported figures.

Bank version

For banks

A bank borrows, mostly through deposits, in order to lend. So debt-to-equity describes its business model more than its risk, and its cash flow moves with its lending.

Replaced
ROIC, debt-to-equity, free cash flow
With
Return on assets, efficiency ratio, equity to assets
S&P 500 diversified and regional banks.

REIT version

For real estate investment trusts

A REIT must pay out most of its taxable income, and depreciation on its buildings lowers the earnings it reports. So five checks use funds from operations (FFO), the measure REITs report, instead of earnings, and capital allocation uses REIT tests.

EPS trend
→
FFO per share trend
ROE trend
→
FFO payout ratio
ROIC
→
Debt to total assets
Retained earnings
→
FFO kept after distributions
Graham value
→
Price-to-FFO
Capital allocation
→
Capital allocation, REIT tests
S&P 500 REITs. FFO is the Nareit-defined figure from each company's 10-K.

Compare a bank's score with other banks, and a REIT's with other REITs. Wherever scores sit side by side, those cards carry a tag saying which version they use.

What it won't do

The judgement stays yours.

  • Gives you the data, the filing and your own record
  • Names the source for what it tells you
  • Lays out the numbers when you ask what to buy, and leaves the decision with you
  • Runs your screen exactly as you set it, and shows the figure behind every match
  • Tell you what to buy, sell or hold
  • Grade whether your thesis is any good
  • Predict where a price is going
  • Choose the companies your screen finds. The rules are yours.

How that is enforced: compliance rules in the AI prompts, plus automated wording checks on AI output.

Where the data comes from

Named sources, in plain sight.

WhatSource
Prices and fundamentalsThird-party market data. Quotes are delayed.
Company filingsSEC EDGAR: 10-K, 10-Q and 8-K filings
REIT funds from operationsEach REIT's 10-K (SEC EDGAR), the Nareit-defined line, shown with the exact text it came from
Economic dataFRED (Federal Reserve Bank of St. Louis)
Analyst ratingsAnalyst consensus via yfinance, labelled as such
AIClaude (Anthropic): Opus for Deep Dive and Investor DNA, Sonnet for Val, synthesis and narrative, turning your words into saved-screen rules, and finding the FFO line in REIT filings, which code then checks against the filing. No AI sets a score.

Who builds it

Sal Pelaez, founder

Sal is a project manager who has delivered products in regulated industries: medical devices, and banking and mortgage. The lesson from both carries into Valerius. If you can't show your work, it doesn't ship.

Valerius is in beta.

Free while in beta. Access is by request.

Questions: salpelaez@valeriusintel.ai